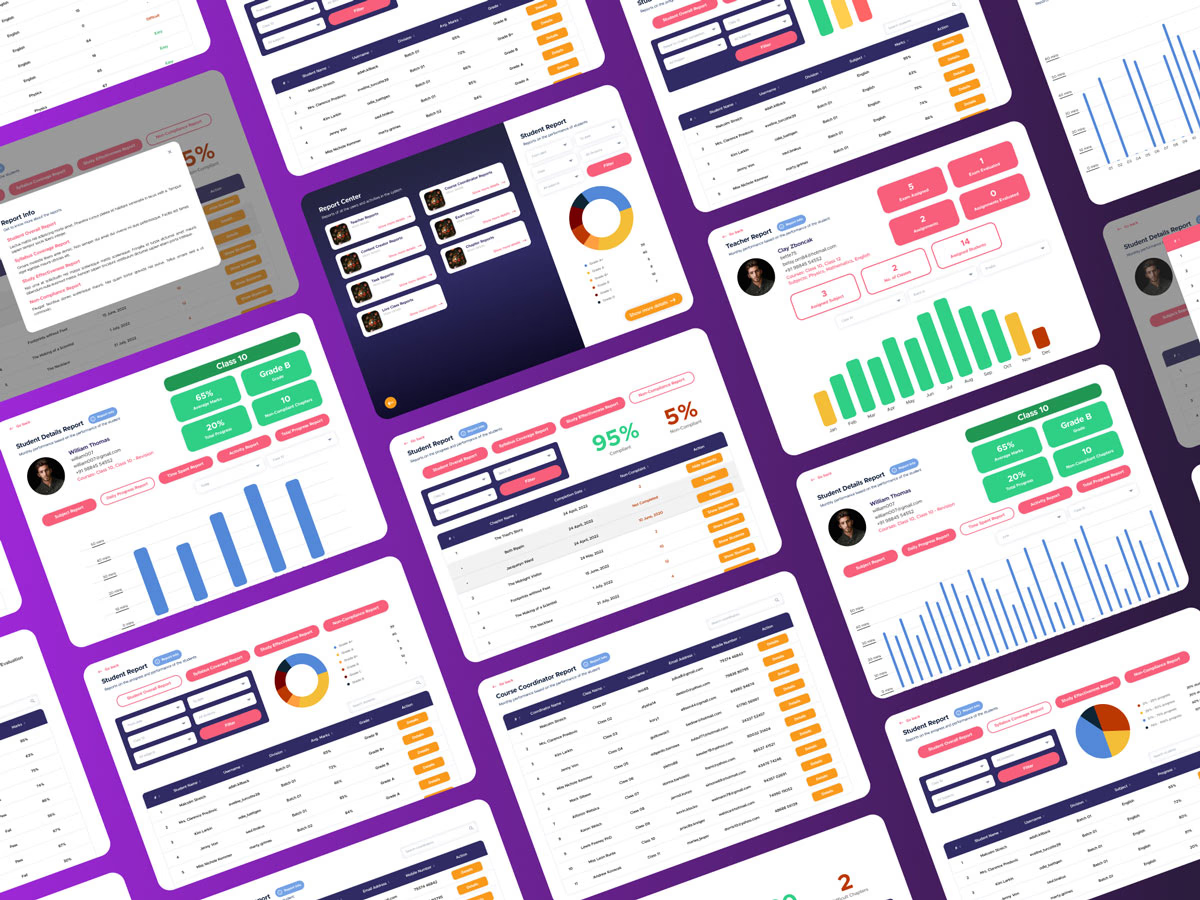
Report Center
Designing Insightful Dashboards for Educators & Admins
Role
UX Designer & Product Owner
Timeline
4 Weeks
Tools
Figma, Jira, Google Sheets, Postman
Category
EdTech, B2B SaaS, UX Design
The Problem
What needed to change?
Institutions using the Baashaa LMS lacked a centralized, actionable reporting system. Academic admins and teachers were forced to rely on raw data exports, fragmented spreadsheets, and constant manual support requests to track performance and user progress.
This friction resulted in delayed decision-making, a heavy dependency on backend teams, and poor visibility across student and teacher workstations. The challenge was to replace these manual workflows with a unified dashboard system that empowered users with self-service analytics.
My Responsibilities
- Stakeholder Research: Conducted deep-dive interviews to identify reporting pain points and data usage patterns across different user roles.
- User Mapping: Defined roles and mapped specific reporting needs for teachers, admins, and content creators.
- UX/UI Architecture: Designed the full information architecture, wireframes, and dashboard interactions, including drill-downs and summaries.
- Decision Strategy: Created a visual hierarchy focused on simplified decision-making and data legibility.
- Cross-Functional Collaboration: Partnered with frontend and backend teams to ensure accurate data visualization and reporting logic.
- Iterative Validation: Refined the product through continuous user feedback and usability testing with institutional admins.
The Approach
How we got there.
Discovery
- Multi-Role Auditing: Interviewed 4-6 stakeholders per role to understand current bottlenecks in accessing raw data.
- Critical Findings: Identified that data was often overwhelming, outdated by the time it was analyzed, and heavily dependent on internal "Export" requests.
Strategy & UX
- Unified Visual Language: Established a shared filtering system and modular UI components to ensure consistency and clarity across diverse report types.
- Progressive Disclosure: Utilized simple charts and highlighted key alerts to provide "at-a-glance" insights without cognitive overload.
- Actionable Dashboards: Developed specialized modules including Student Performance, Teacher Contribution, and Course Analytics to provide granular, role-specific data.
- Dynamic Intelligence: Implemented dynamic filtering by course, subject, month, and student to allow for deep-dive investigations.
Delivery & Iteration
- Component-Driven Build: Developed the MVP using component-wise wireframes in iterative cycles, testing each section for functional accuracy.
- Feedback Loops: Conducted extensive usability testing with institutional admins to refine the admin and progress-focused views.
- Subject-Level Precision: Integrated time-tracking and subject-level drill-downs to give teachers more control over student progress monitoring.
The Outcome
Results that speak.
The transition to a centralized reporting hub delivered immediate, measurable improvements to institutional efficiency:
- Access Speed: Achieved ~40% faster data access through role-specific dashboards and context-aware filters.
- Reduced Overhead: Realized a ~60% drop in daily report requests sent to the backend support team.
- Improved Evaluation: Enabled 3x faster student evaluation for teachers through intuitive, visualized summaries.
- Stakeholder Satisfaction: Significantly enhanced decision-making capacity for admins by providing a scalable foundation for data-driven growth.